Transit Time Analysis for Last-Mile Optimization (Pro Tips + 5 Example Charts)
Speed is critical in last-mile delivery, impacting both cost and customer satisfaction. Today, 67% of organizations consider meeting customer expectations for speedy delivery as a key factor shaping their supply chain structures in the next 12-18 months. Faster shipments mean lower storage costs and fewer redelivery attempts, contributing to significant operational savings. In short, getting orders to your customers fast, helps you avoid unnecessary costs.
On the other hand, the faster your customers receive their orders, the happier they are and the more likely they will return to your store. This makes shipment transit time analysis a priority for your logistics operations team. However, each carrier has a different set of delivery milestones, hence different definitions of transit times, making it challenging to keep track of such a logistics KPI.
We resolve that by integrating and harmonizing logistics data across 1,100+ global carriers. With the Transit Time report (available with any Parcel Perform experience), you can deep dive into individual carrier performance using one cohesive logistics data standard–from the initial shipping event until the first delivery attempt.
Here’s a breakdown of the report’s 5 key charts and how you can best use them to analyze how efficient your last-mile deliveries are.
Transit Time Overview
Transit Time Distribution over time
Average Transit Time
Transit Time Distribution
Average Transit Time Overview per Destination Country and Carrier
A quick scan for any abnormalities in the last-mile delivery journey
Shipment delivery speeds fluctuate due to many reasons–e-commerce peak seasons, supply chain disruptions, and more. The Transit Time Overview chart helps to reveal such trends and uncover abnormal spikes that may require further attention.
Here’s our recommendation on how to best utilize the chart: First, set a target parcel delivery time for periods when longer transit times are expected–for example during major holidays or scheduled promotional periods. Next, benchmark the recorded transit times from the chart against your initial target times to see if targets are met, or if there are any exceptions.
Pro tip: To exclude any transit time variations from your analysis, simply deselect the labels on the right side of the chart.
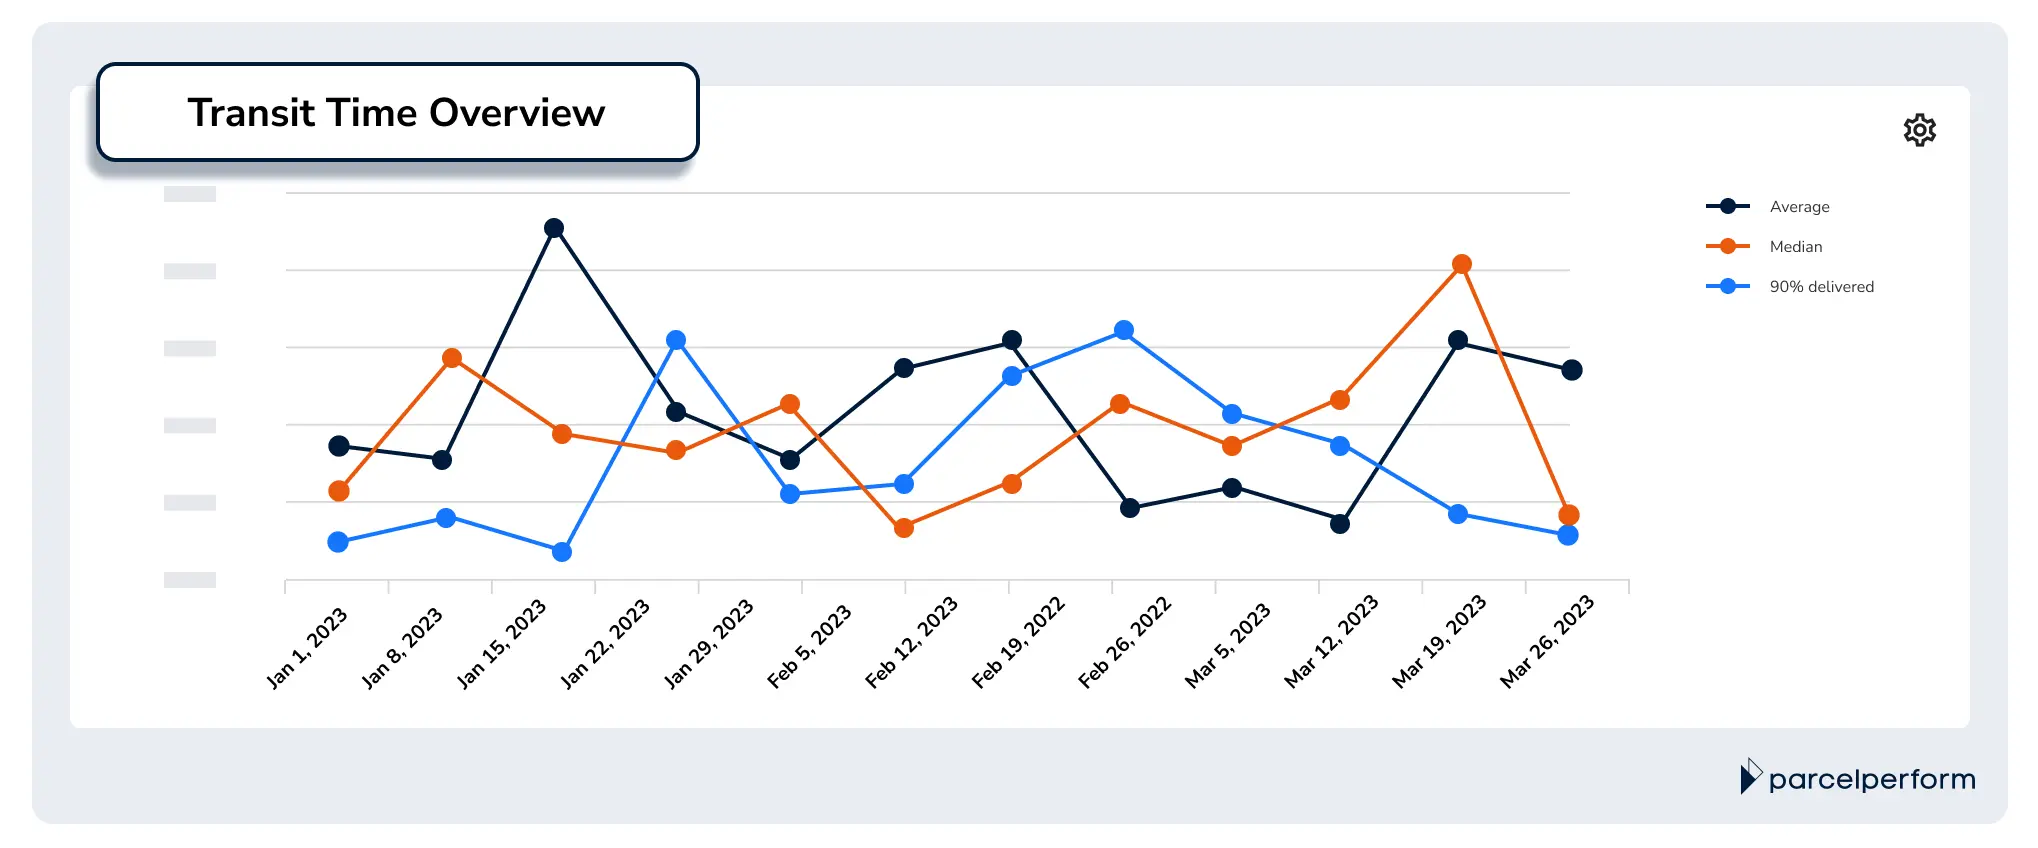
The Transit Time Overview chart shows the transit time averages, medians, and when 90% delivered over the specified time period.
Keeping track of the delivery speed for the bulk of your shipments
Transit time averages can skew due to unforeseen circumstances, such as adverse weather conditions or lost packages. The Transit Time Distribution over time chart provides an alternative view by showing the percentage of shipments successfully delivered at every significant time interval.
From this chart, you can see the various transit times of your parcels, starting from same-day deliveries to those that take more than 10 days to deliver. The chart is especially helpful in monitoring if your shipments are hitting the mark on delivery performance.
For example, say you would like to examine the delivery speed for 90% of your shipments. Simply go around the table and highlight the values of the corresponding percentage. You will be able to answer the following questions:
How long does it take your carriers to make the first delivery attempt for 90% of your shipments?
Does the actual delivery duration meet the benchmark you’ve set?
At which time of the week, month, or year did the delivery speed not hit the mark?
Pro tip: When sharing logistics intelligence with your customer service teams, this is a great chart to put side-by-side with CSAT scores to draw correlations between customer satisfaction and delivery performance.
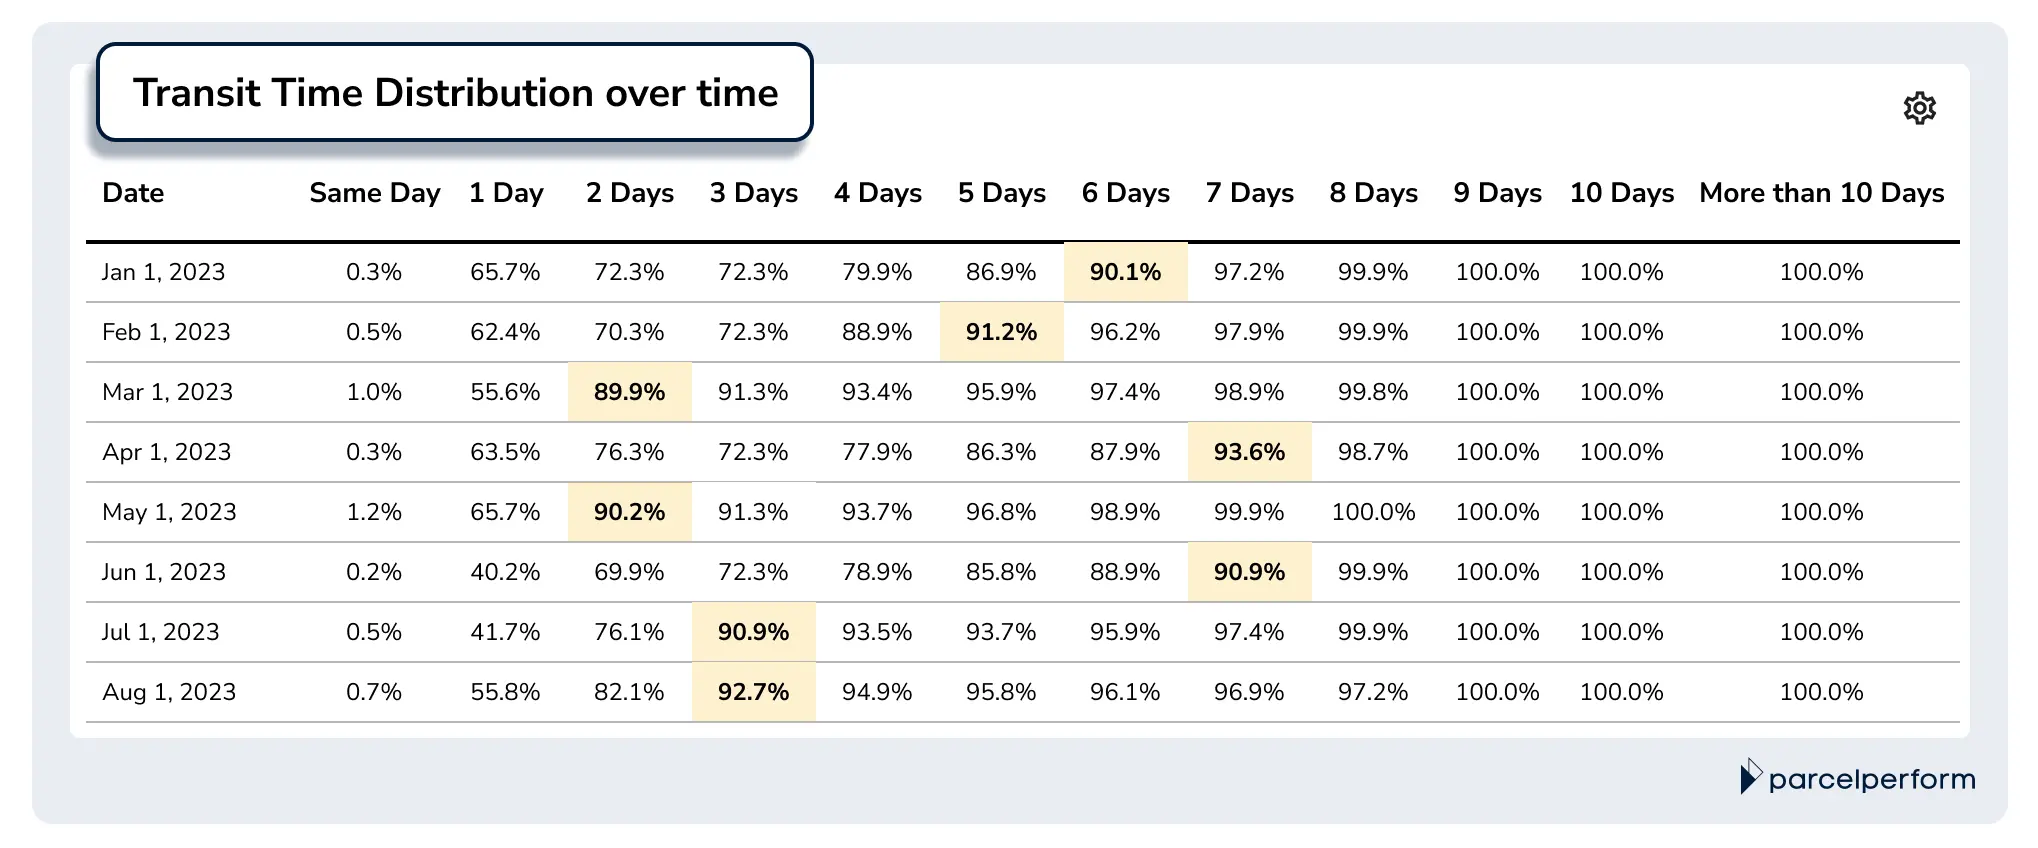
The Transit Time Distribution over time chart shows the percentage of successfully delivered shipments over the transit time durations - ranging from same-day delivery to over 10 days.
Evaluate delivery speeds across different seasons and target markets
The Average Transit Time chart shows the number of days your carriers take to make the first delivery attempt. You can choose to compare this key metric over days, weeks, or months.
The chart is available in 2 variants.
The Carrier variant helps to identify carrier partners whose delivery speed is not up to par. For instance, if a carrier consistently reports higher transit times than others, it may indicate that they are struggling with a high shipment volume. In this case, you can consider reducing their load to improve delivery speed. This approach also helps to ensure a smooth and seamless delivery experience for your customers.
The Destination Country variant reveals transit time patterns in your top-performing markets. For example, countries that rely on national postal services may have spikes in transit time durations over the weekends.
Another example can be that Asian countries celebrating the Lunar New Year may experience extended periods of longer-than-usual delivery times during the early months of the year. Such insights can be valuable to your customer service teams, helping them inform customers of potential delays.
Pro tip: If the transit time definition (first shipping event to first delivery attempt) doesn’t suit your use case, consider using the Average Transit Time by Different Shipping Phases and split by Carrier chart in the Carrier Performance report, which examines carrier delivery speeds using 4 different milestones.
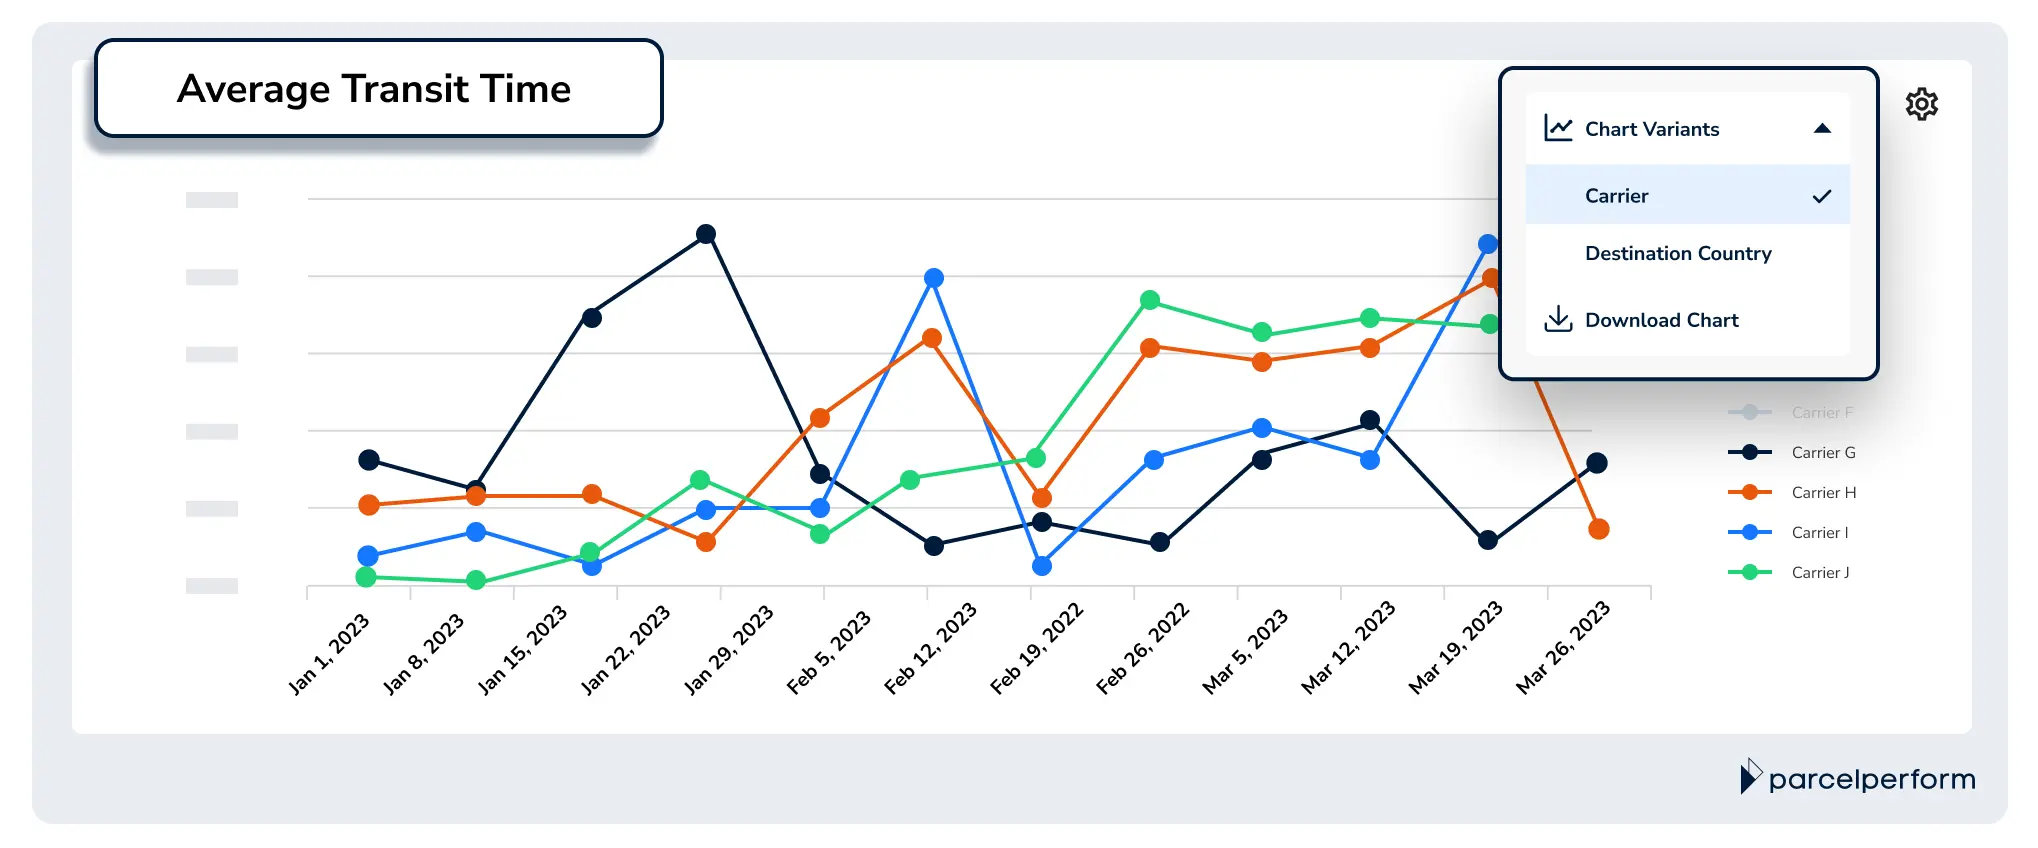
The Average Transit Time chart shows the average transit time for carriers and destination countries over the specified time period.
A quick assessment of carrier efficiency
Understanding last-mile delivery efficiency is crucial to optimizing your logistics strategies. Whether choosing the right carrier partners or eliminating delivery bottlenecks in specific countries.
The Transit Time Distribution chart, available in 2 variants, breaks down the percentage of shipments successfully delivered across various transit times–ranging from same-day to more than 10 days.
The Carrier variant chart gives you insights into which carriers deliver the most shipments in the shortest time. This could be valuable information when finding out which carriers are more reliable during peak seasons.
The Destination Country variant chart shows the most common delivery speed in your top-performing markets. This allows you to easily benchmark delivery speeds against customers’ expectations in each country and identify potential gaps in their delivery experience with your business.
Pro tip: To learn more about carrier performance in your top-performing markets, filter by “Carrier” in the Transit Time Distribution - Destination Country chart variant.
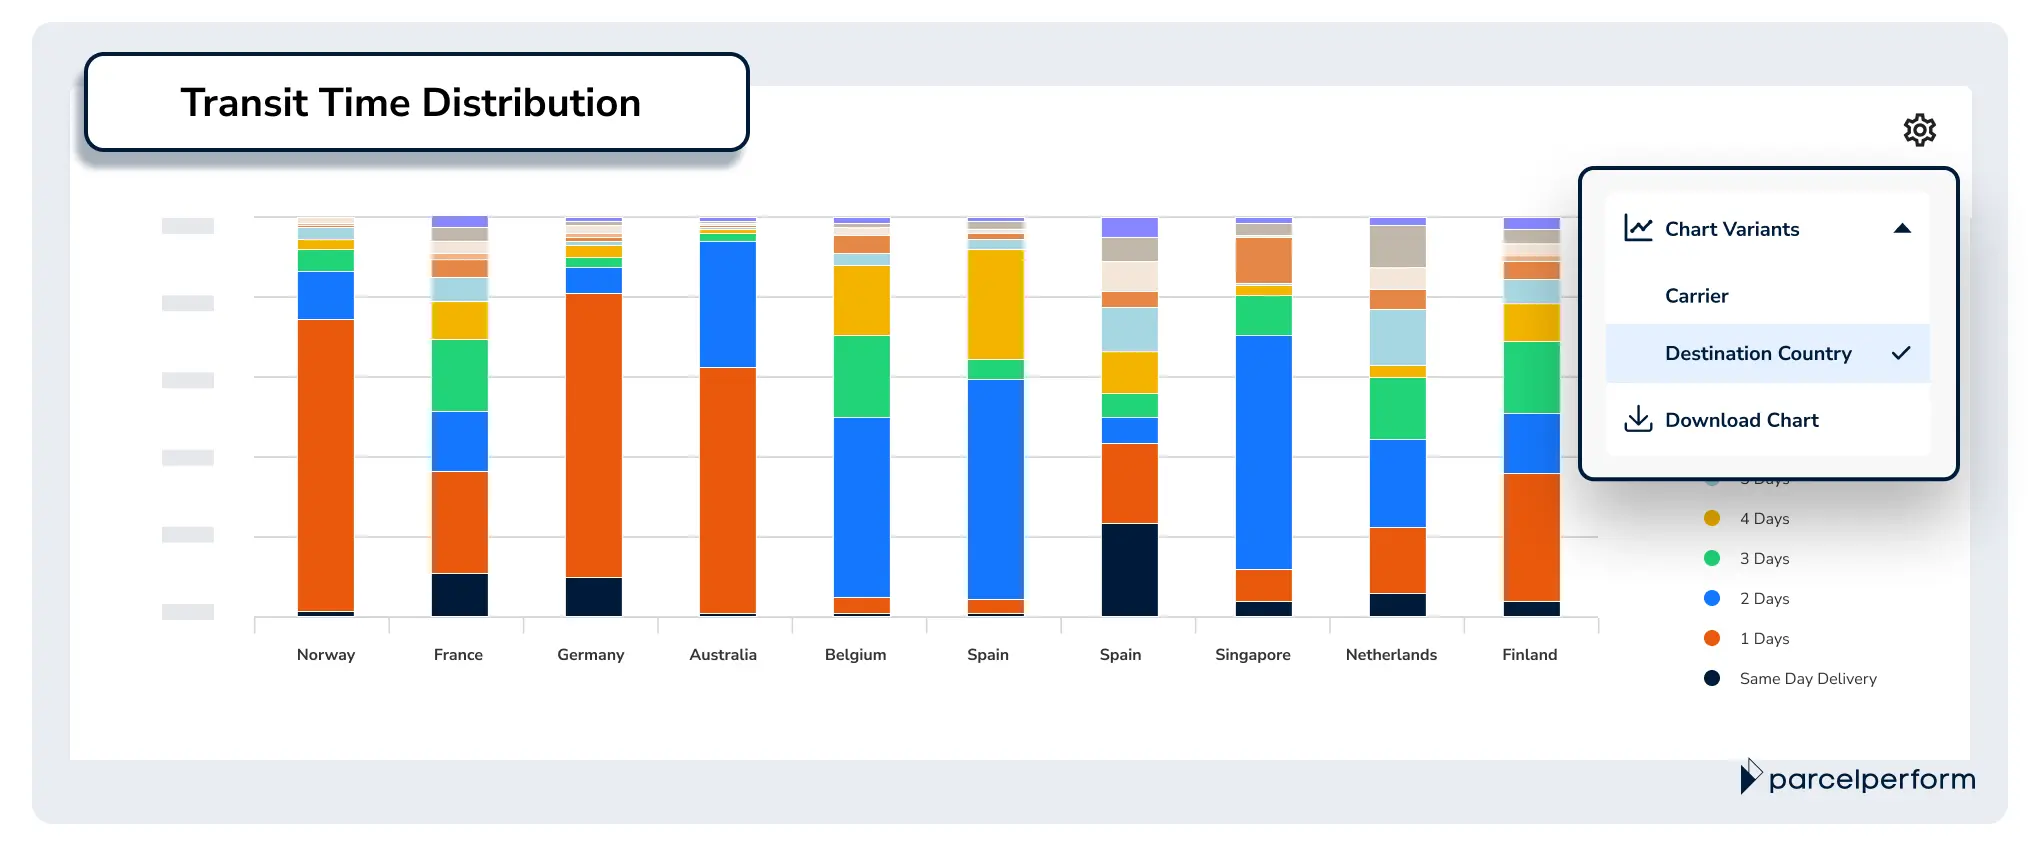
The Transit Time Distribution chart shows the percentage of successfully delivered shipments by top-performing carriers and destination countries over the transit time durations, ranging from same-day delivery to over 10 days
Zoom into your carriers’ last-mile delivery speed in each country
Carrier delivery times can vary greatly not only throughout the year but also in different countries. As e-commerce businesses grow their reach across regions, it becomes increasingly challenging to monitor the delivery performance of their carriers.
The Transit Time Overview per Destination Country and Carrier chart resolves that by comparing transit times across carriers and destination countries simultaneously. This provides you with a quick overview of carrier performance in each country.
Pro tip: If you have large shipment volumes in many countries, the chart can get massive. Apply the“Destination Country” filter and compare carrier performance one country at a time.
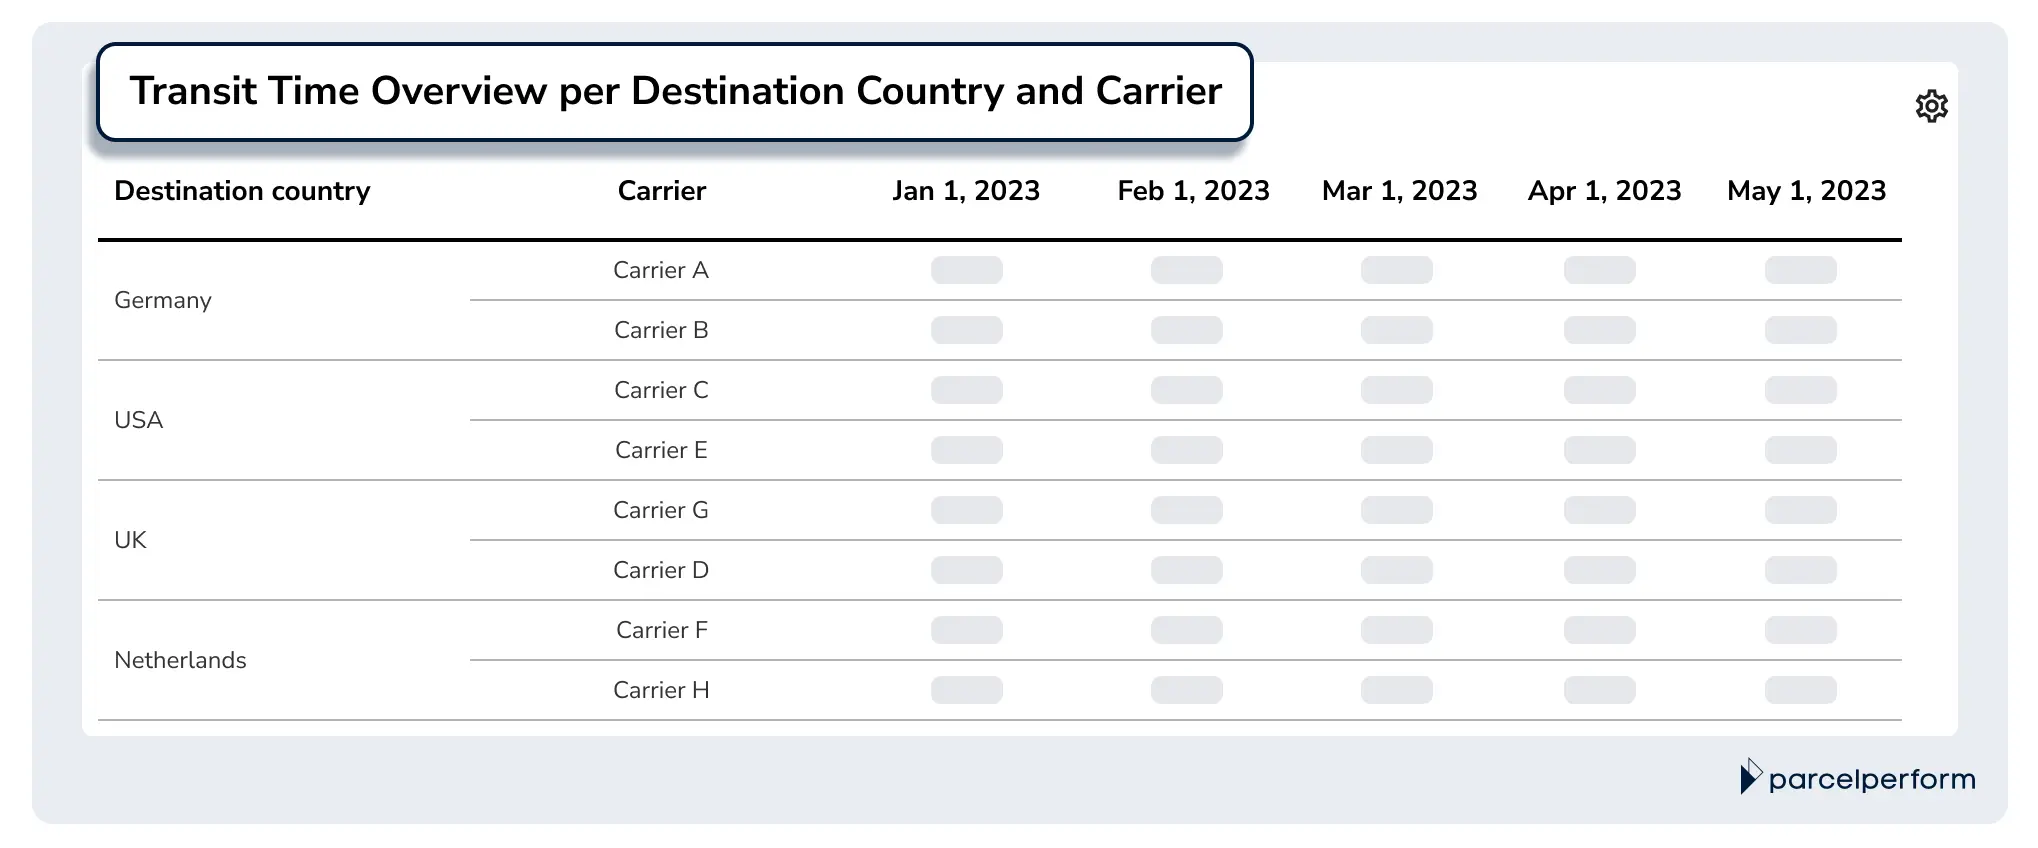
The Transit Time Overview per Destination Country and Carrier shows a breakdown of transit time durations of each carrier within a destination country across the specified time period
Transit time insights for peak season planning
Parcel Perform’s Transit Time report is designed to provide different perspectives on your shipments’ delivery speed. The transit time insights available can help internal teams forecast carrier capacity and formulate effective customer engagement strategies during peak seasons.
For example, you can adjust your carrier arrangements or inform customers of potentially longer delivery times before they make a purchase.
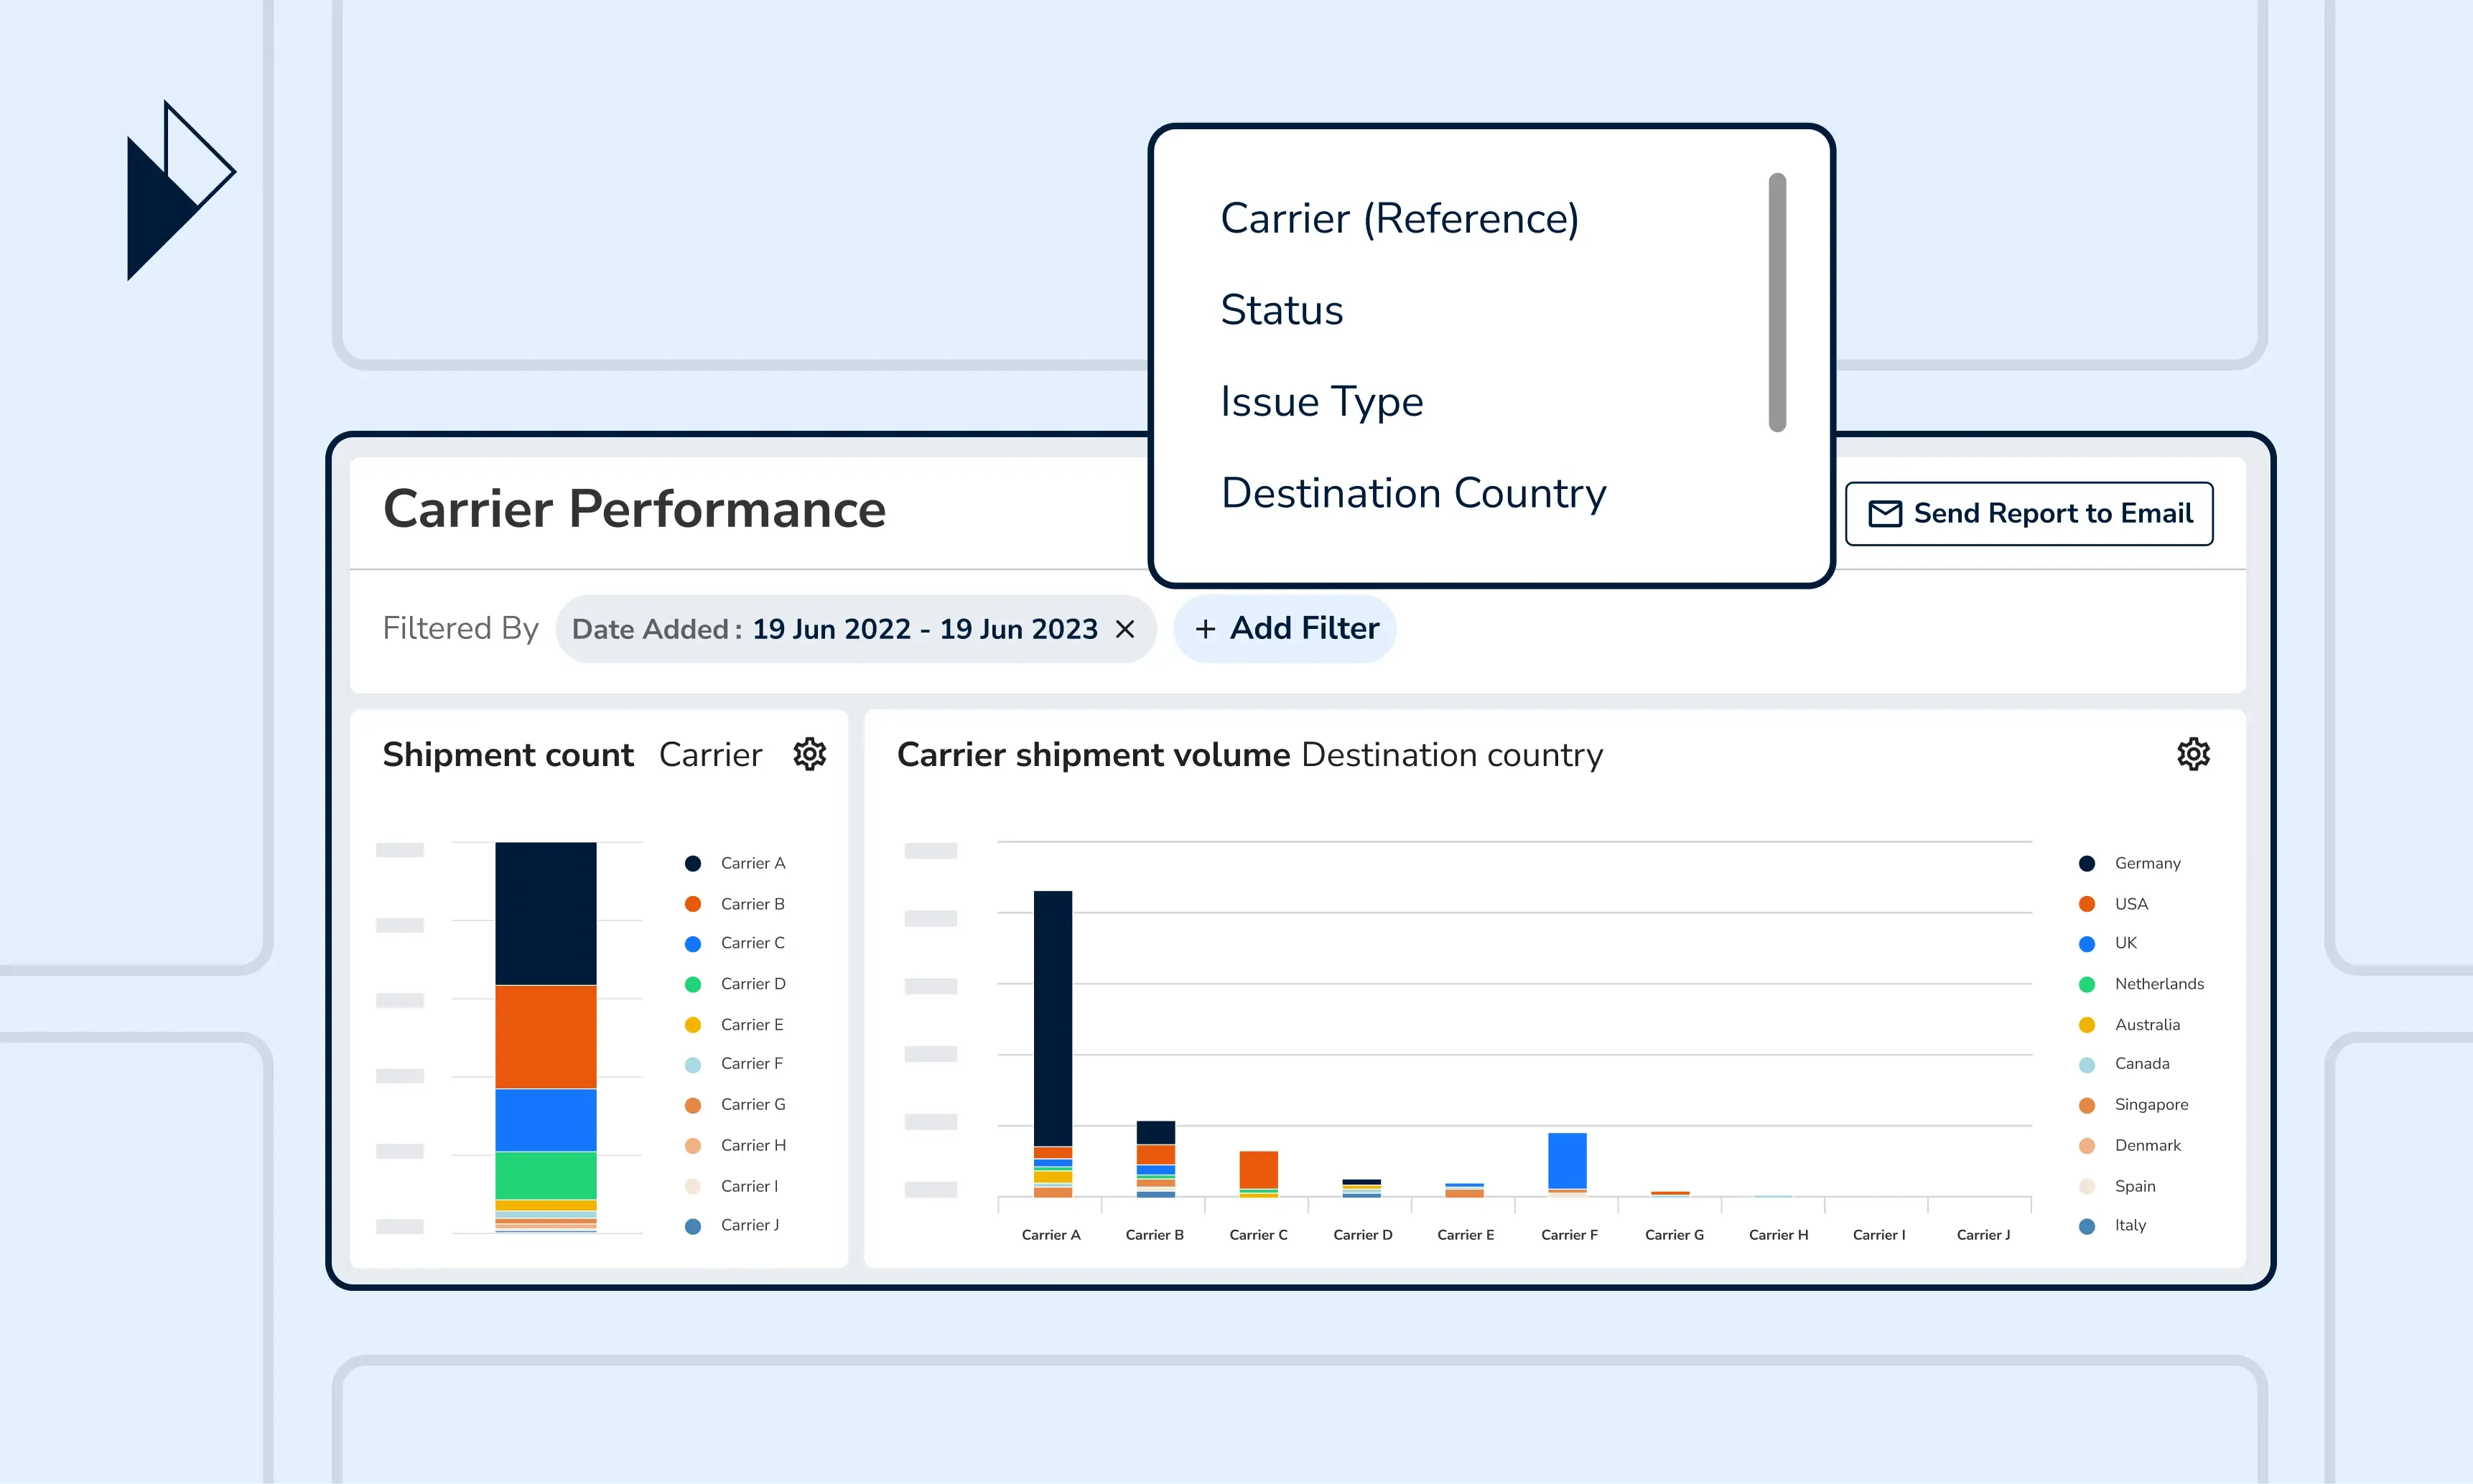
Besides the default logistics chart displays, you can apply filters and view the charts from various perspectives for a complete overview (with deeper insights) of your logistics setup. Our platform also lets you capture snapshots of any chart and share them via a message, or send the entire report via email to key stakeholders.
Book a demo with our e-commerce logistics experts now, and we’ll guide you through the best practices for shipment reporting through our standard reports. Learn how you can easily monitor and improve logistics operations from day 1 with our industry-leading data and delivery experience platform.

You might also like
Overcome these 6 barriers to maximize returns profits
The path to profitable returns is not an easy one. Here are several barriers that e-commerce businesses face.
Dec 14, 2023