Introducing: Enhanced Logistics Intelligence Features
There’s an often-quoted saying in recent years: data is the new oil.
But we at Parcel Perform want to add in another often-neglected perspective to that adage: data is only useful when refined.
Organizations that can capture the right data, refine it and use the insights from data effectively to make business decisions will thrive. And today, we’re excited to present an upgraded Logistics Intelligence feature within our platform to help you refine and get actionable insights from your logistics data.
We’ve introduced some updates to the platform UI that maintains the ease of use and flexibility you know and love but will help you enhance visibility on your logistics performance and enable collaboration within your teams.
This update to our Logistics Intelligence feature provides you with:
A whole new way to manage, create and share logistics reports across your organization or team members. Share and review your latest logistics insights with your team. in just a few clicks.
A wide variety of customizable reports to help you get even more specific logistics insights and create views targeted to your business needs at any given time.
Let’s dive into what our new Logistics Intelligence feature can do for you.
An all-new Logistics Intelligence Overview page to help you organize, share and view all your logistics reports.
Sharing logistics reports across a large team is now made even easier in this update! We’re introducing some new features to help collaborate, share and manage logistics reports across your teams.
View and create your own reports, share customized reports across your organization account and see all Parcel Perform standard reports within the Logistics Intelligence Overview page.
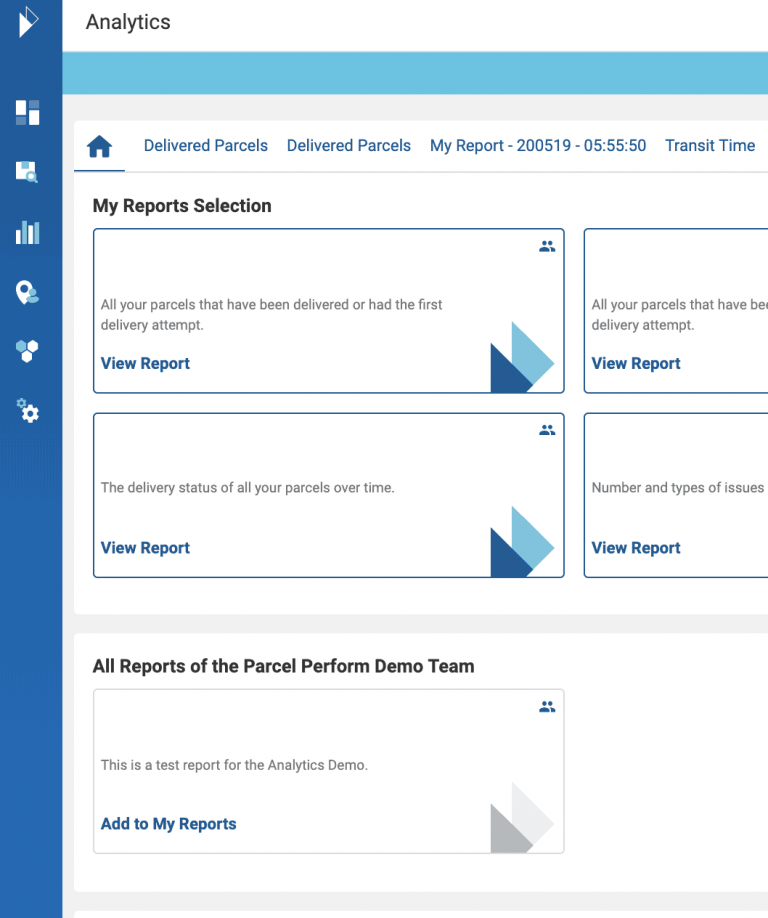
Here’s what you can do in the three new sections of the Logistics Intelligence Overview - My Reports, Organisation Reports and Parcel Perform Standard Reports.
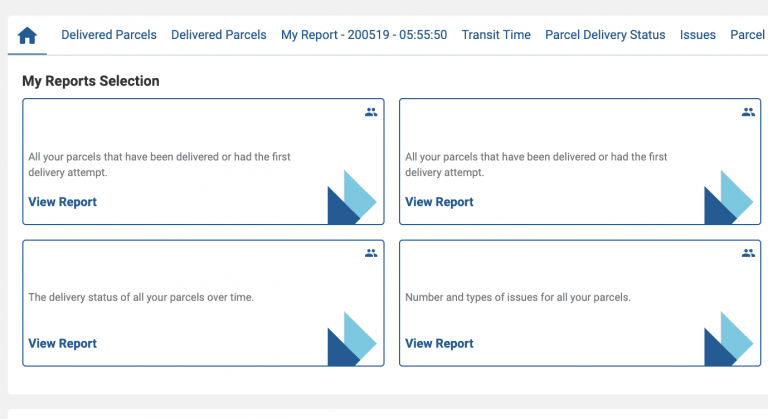
1. Manage your own reports with the My Reports section:
In My Reports, quickly view and access:
Reports created by you
Shared reports within the organization or Parcel Perform standard reports that you’ve added to your reports
Shared or standard reports that you’ve copied to your own reports
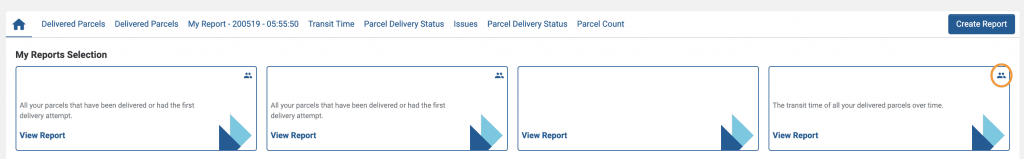
Each report gets its own tile and also its own corresponding tab at the top of the page for easy identification. Simply click View Report in each tile or click on the tab above to pull up an individual report. Titles of newly created reports will be “My Report - <#>, with the number indicative of the number of reports you have in the My Reports section.
For example: if you have 7 reports in this section, the new report title will be "My Report - 8".
You’ll also be able to drag & drop reports in `My Reports selection` to change the order of the reports. Move the report tiles or move the tabs on top of the page to customize the overview as desired - the order of the report tiles and tabs is always the same.
2. Harness the power of collaboration in your organization with the All Reports Across Your Organization section:
Promoting and enhancing collaboration is a major focus of this Logistics Intelligence update.
Now you have the power to create and share reports across your organization. This section of the Overview shows the reports that are created and shared by a user within your organization.
Quickly share information within your team or save time when preparing for management or team meetings.
Shared reports are indicated by the shared icon:
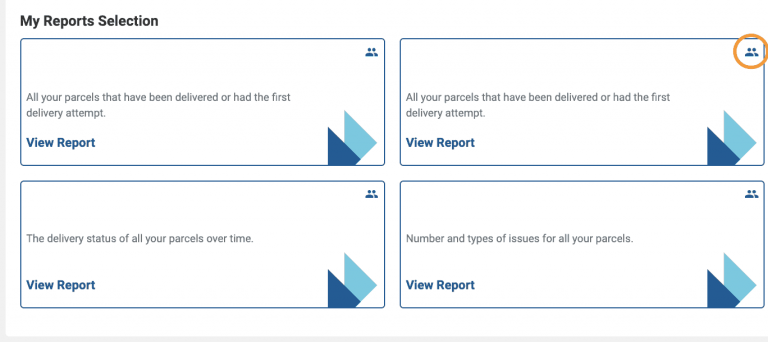
Here’s how to manage which reports are shared within your organization or with you.
If you created the shared report and want to make changes:
Edit the report directly. Your changes to your shared report will be visible across the organization.
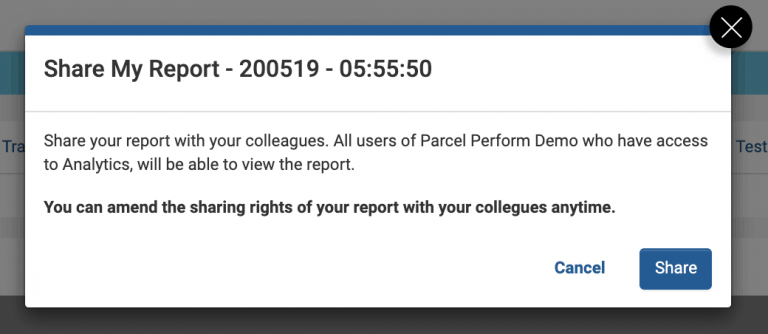
How to share your created custom report with your colleagues:
Navigate to the top-right corner of your report and click on the Share icon.
Click on Share in the subsequent confirmation prompt, and you’re all set to go!
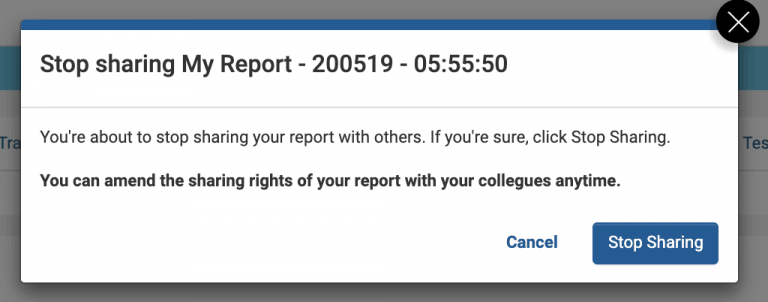
To stop sharing or remove your report from your organization:
Shared a report by mistake or want to stop sharing a report? No worries, click on the same button and you can stop sharing your report.
Similarly, clicking on the trash can icon removes a report that you’re viewing. If you remove a report that you’ve created, it will also remove the report for other users within the organization.
Managing reports shared with you by your colleagues.
If a colleague has shared a report with you, you’ll automatically be in its View mode once opened. In this mode, reports cannot be edited.
If you wish to edit, make a copy of the report you want to edit and it’ll be added to your My Reports section. Copies of a report will automatically be given a title “Copy of <report title>” From here, you’ll be able to edit or share them to your own liking.
You can also remove a report that is shared with you from your My Reports section. Take note, removing a report that’s created by another Parcel Perform user will only remove it from your My Reports section. The report will still be available for other people’s reference in the All Reports of your Organisation section of the Overview.
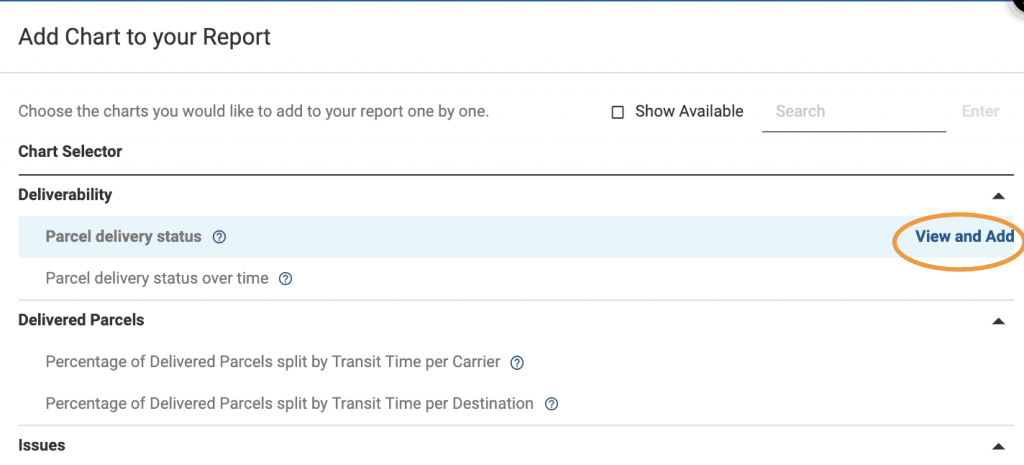
3. Quickly get started with our logistics report templates under All Parcel Perform Standard Reports:
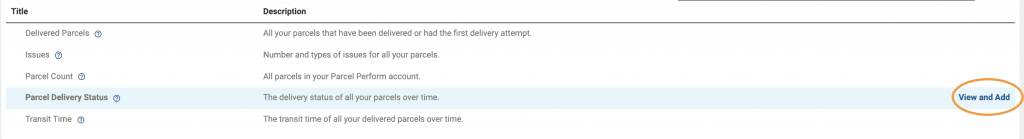
To help you get started with measuring and tracking your logistics performance, we’ve included a comprehensive set of standard reports covering common logistics reporting metrics.
Reports available to you depends on your level of user permissions or account subscription. If a report is available to you, click on ‘View and Add’ to add the standard report to the My Reports section.
Create your own logistics reports across data dimensions of your choice
With our latest Parcel Perform update, you can now create and manage multiple logistics reports simultaneously within the Logistics Intelligence Overview. What’s more, you also have full flexibility to determine the data dimensions you want to analyze in a report!
Either add a single chart multiple times while varying the data shown to do a detailed analysis on a certain metric or compare performance trends across different macro trends; the choice is yours.
How to create your own custom report.
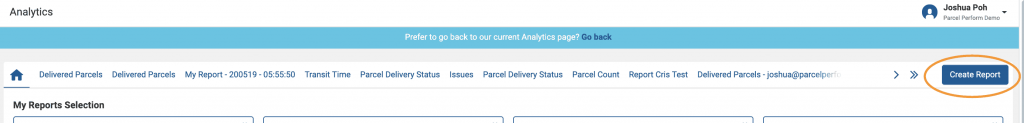
From the Logistics Intelligence Overview screen, click on Create Report to begin generating your report by adding your first chart.
Click on the View and Add button on your desired chart to generate your report.
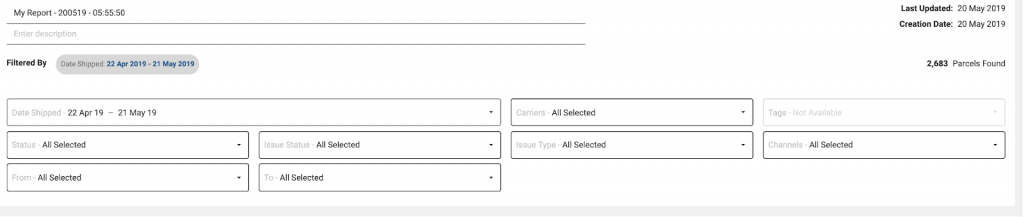
Want to modify and filter the data being displayed? Our powerful parcel filters first introduced in the Parcel Overview screen can also be used within the Logistics Intelligence feature.! These give you nearly unlimited potential for customization to your desired requirements.
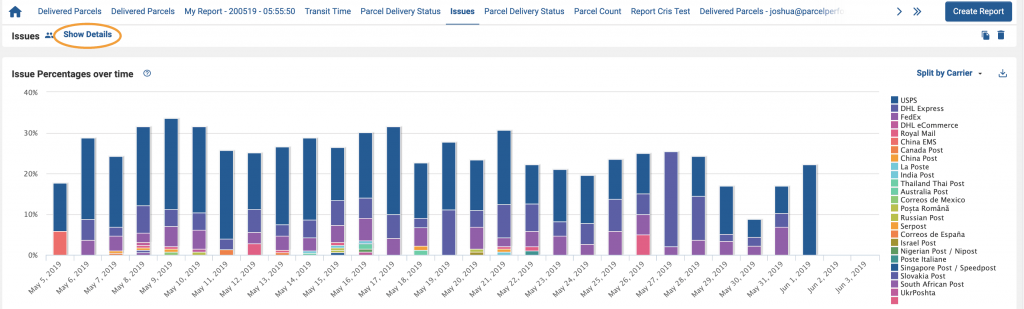
Start by clicking on Show Details. You’ll have the option to Change Filters; allowing you to modify your filters to your liking.
Data displays within the reports are dynamic - adjust the filters and our software automatically pulls in the relevant data according to your filter selection after you’ve applied your changes within the report.
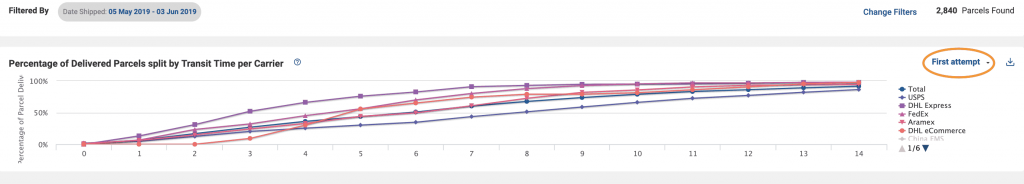
Access filters by clicking on Change Filters.
Time Saving Tip: Charts are also downloadable as images in .png format. Use these images to quickly prepare visuals for your logistics management meetings or in your reporting.
Unlock unlimited potential for analysis by including multiple charts in a single report.
We’ve saved the best use case for last!
Did you know you can now include multiple charts within a single report? A logistics report can now have eight such charts - allowing you to conduct several analyses simultaneously in a single report! Now you can look at multiple associated metrics and compare them across the same timeframe.
Adding additional charts is simple. As long as you’ve not reached the maximum number of 8 charts within a report, you’ll see a prompt to add charts in as desired.
TIP: Want to customize your analytics charts even further for even more specific analysis? Contact your account manager for more details or drop us a note and we’ll be more than happy to help you!
How to make full use of our new Logistics Intelligence feature.
We’ve shared a lot of cool features and upgrades, but how do you use them to enhance your reporting or data analysis processes? We have some suggestions.
Look into your over the last 14 days. Analyze delivery trends across the month; have the issues been solved? What kind of issues are your deliveries facing? Which carriers are encountering issues? With detailed data, it’s easier to find answers to these questions.
Determine the total number of pending parcels in a popular trade route and compare it with parcels with issues to analyze correlations or other data trends.
Conduct in-depth and macro logistics analysis simultaneously. For instance, you could look at quarterly logistics performance and compare individual carrier performance across a crucial within one report.
Be the first to check out our new, upgraded Logistics Intelligence feature.
To recap, you can now:
Manage, create and share reports within your organization in a few clicks.
An easy-to-use, new UI that gives you access to all our powerful features with a few clicks and see all key carrier performance indicators at a single glance.
View multiple charts in a single report, giving you unlimited potential for analysis across multiple dimensions. Use our powerful filters to adjust the data displayed for your own reporting needs.
UPDATE: You'll now automatically land on the new Logistics Intelligence view. However, if you'll like to use the previous version, click on the banner at the top of the screen.
We’re sure you’ll find these enhancements useful to get meaningful insights on your logistics data and enhance your reporting processes.
Questions about these new upgrades? Our team is on standby to help you out! Reach us anytime.
You might also like
Parcel Perform Named a Leader in the Spring 2026 Reports by Real Users on G2
Parcel Perform is a G2 Spring 2026 Leader in Package Tracking, offering top operational excellence and AI visibility.
Mar 24, 2026
Parcel Perform
How Signed Agent Requests Secure E‑Commerce APIs and Checkout Data
Stop API tampering in its tracks. Learn how signed agent requests secure e-commerce checkouts and AI shopping bots.
Mar 20, 2026
Parcel Perform
The HTTPS Staging Site Myth: How Bots and AI Expose Your “Hidden” E‑Commerce URLs
Think your staging site is hidden? SSL certs expose dev URLs to AI bots via public logs. Learn how to secure your data.
Mar 19, 2026
Parcel Perform